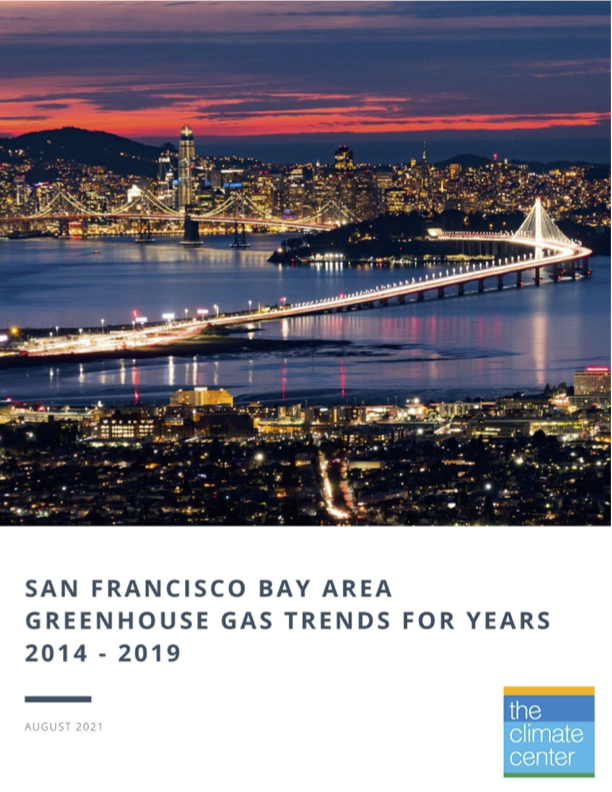
The San Francisco Bay area is home to almost 8 million Californians. The region consists of rural, urban, industrial, and suburban areas that represent a wide cross-section of California.
The Climate Center conducted a report to determine greenhouse gas trends in the region in order to help policymakers determine challenges and opportunities for reducing emissions in line with the science. The report is the most up-to-date effort to evaluate the Bay Area’s climate progress and covers the nine Bay Area Counties: Alameda, Contra Costa, Marin, Napa, San Francisco, Sonoma, Solano, San Mateo, and Santa Clara.
- Click here for the spreadsheet with supportive data (xlsx).
Key findings:
This report confirms the need to address emissions through the suite of bold policies outlined in The Climate Center’s Climate-Safe California campaign.
Emissions in the Bay Area dropped by 3.6 percent between 2014 and 2019. This rate is too slow to be consistent with Paris Agreement targets. The largest emissions drop in the Bay Area was between 2017 and 2018, when emissions decreased by 3.3 percent. But according to recent analysis, California must reduce its emissions by 7.7 percent every year between 2020 and 2030 to stay on track with the Paris Agreement goal of limiting global warming to 1.5 degrees Celsius.
The electricity sector showed the most significant progress, reducing its emissions by 52 percent between 2014 and 2019. This decarbonization is largely driven by the impacts of Community Choice Agencies that have sprung up throughout the Bay Area.
Other sectors actually increased their carbon footprints. Transportation emissions grew by 19 percent, natural gas by 8.9 percent, and solid waste by 25.8 percent. Transportation continues to be the sector with the largest carbon footprint. Growth in the solid waste emissions footprint is due in large part to increased disposal of debris from wildfires.
Complicating the region and state’s climate goals is the increasing prevalence of large wildfires. According to the California Air Resources Board, the 2020 wildfire season produced an additional 110 million metric tons of carbon dioxide, more than a quarter of the state’s total emissions footprint.
Between 2014 and 2019, the Bay Area’s climate progress was slower than both California’s and the nation’s overall, which reduced emissions by 5.6 percent and 3.9 percent respectively. The Climate Center used publicly available data and a replicable model to assess greenhouse gas trends that cover 70 to 90 percent of the region’s emissions.

Jock Gilchrist

